ET Pro Telemetry edition
Todays cybersecurity engineers need timely and accurate data about eminent threats and how they spread around the globe. With this data cybersecurity researchers and analysts can improve the detection of malicious network traffic. The times when we could rely on just firewall rules for our protection are long gone. Additional layers of security are desperately needed to guard against these attacks.
With growing risks the need to fortify our security is growing for both big enterprises as for SMEs alike, but often out of reach for the latter. An important extra security addition is an Intrusion Detection and Prevention System (IDS/IPS).
The IDS/IPS available in OPNsense is based on Suricata. This open source IDS/IPS engine has proven its value in OPNsense, especially in combination with the free Proofpoint ETOpen ruleset.
The need for valuable threat detection data and the increasing importance of additional network security has brought Proofpoint and OPNsense together. Our joined efforts resulted in the ET Pro Telemetry edition.
The ET Pro Telemetry edition embraces our vision that sharing knowledge leads to better products.
When you allow your OPNsense system to share anonymized information about detected threats - the alerts - you are able to use the ET Pro ruleset free of charge.
The ET Pro ruleset is updated daily and covers more than 40 different categories of network behaviors, malware command and control, DoS attacks, botnets, informational events, exploits, vulnerabilities, SCADA network protocols, exploit kit activity, and more. If offers a great improvement over the ET open ruleset.
Product information
For more information about emerging threats ETPro including the Telemetry edition, please visit their discord available at https://community.emergingthreats.net/. The following links are likely of interest:
Registration
When you register for this (free) service, you will share your basic (company) details with us, Deciso Sales B.V.. We will register your sensor(s) anonymized at Proofpoint.
Note
When ET Pro Telemetry is activated, your OPNsense system sends data to Proofpoint. Proofpoint does not know who you are, they only know how many sensors an account owns. Your network statistics received by Proofpoint won’t be shared with us.
Sign up for ET Pro Telemetry edition here
Installation
After registration, we can proceed to the installation steps, which are described below.
Note
To use ET Pro Telemetry, you will need to have OPNsense 19.1 or higher installed. When using an older version, please upgrade to the latest first.
plugin
First we need to install the required plugin, which is responsible for collecting the telemetry data and provides access to the ET Pro ruleset.
Go to
press “Check for updates” in the upper right corner.
open the tab “Plugins” and search for os-etpro-telemetry
when found, click on the [+] sign on the right to install the plugin
A screen containing the installation status should appear now and the plugin is ready for use.
register token
Next step is to register your token in OPNsense and enable rulesets.
Go to
Click on the “Download” tab, which should show you a list of available rules.
Enable all categories you would like to monitor in the “ET telemetry” section, if in doubt enable all and monitor the alerts later (select on the right and use the enable selected button on top)
At the bottom of the page there’s a block containing settings, paste the token code you received via email in et_telemetry.token
Press save to persist your token code
Press Download & Update rules to fetch the current ruleset
Schedule updates
To download the rulesets automatically on a daily bases, you can add a schedule for this task.
Go to
Click on the “Schedule” tab
A popup for the update task appears, enable it using the checkbox on top, and click “save changes”
Subscription status
To validate your subscription, we recommend to add the widget to the dashboard.
Go to the dashboard
Click on “Add widget” in the top right corner, click “Telemetry status” in the list
Close dialog and click “Save settings” on the right top of the dashboard
Open again to refresh the content
When everything is setup properly and the plugin can reach Proofpoint, it will show something like:
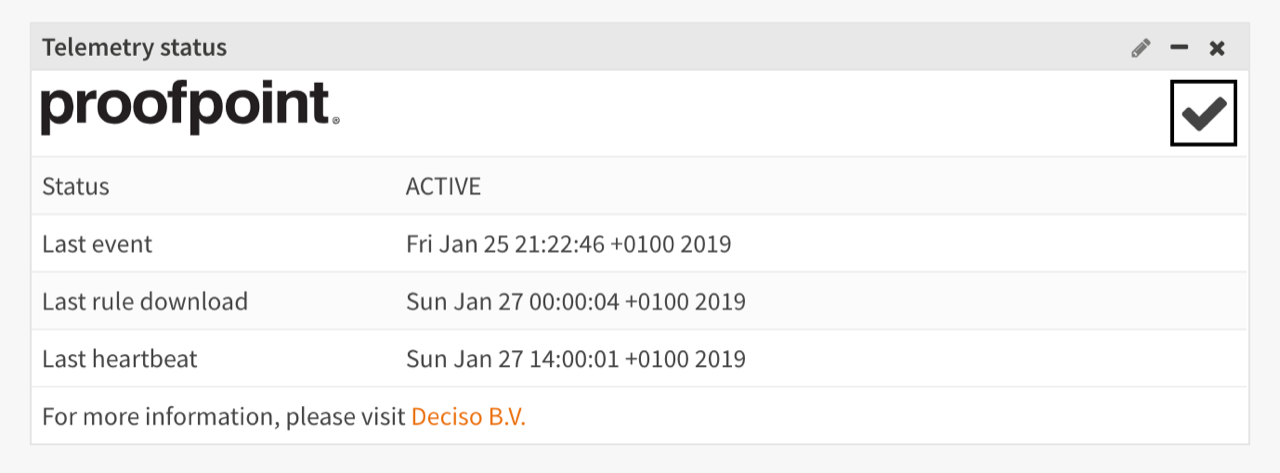
The status determines which ruleset your sensor will receive, ACTIVE or DORMANT your sensor will receive ET Pro ruleset, when DISABLED the license conditions are not met and the ET Open ruleset will be served.
All timestamps underneath the status provide you with information when data was send or received from Proofpoint.
Note
If your sensor will start sending events and heartbeats, it should switch to active after a certain amount of time.
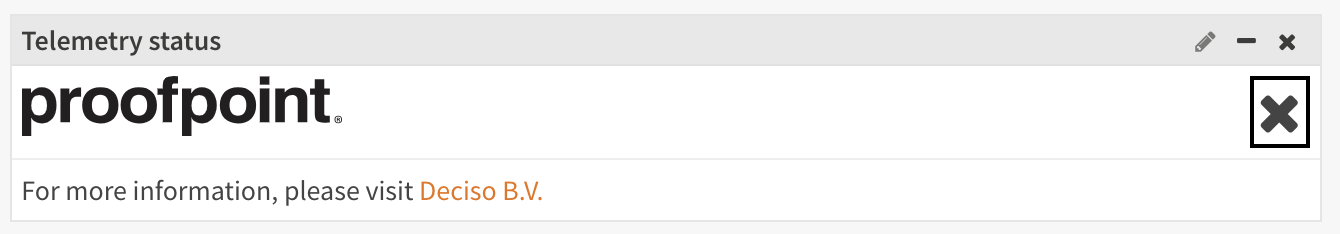
In case your sensor can’t communicate to the outside world, the widget shows an error.
Note
The system log () might contain more information, search for emergingthreats
Tip
Always check the token code first, a common mistake is adding leading or trailing spaces to the code, which will show an error in the log (http_code starting with a 4 usually).
Information sent to Proofpoint ©
When the intrusion detection system logs events, they will be (partially) sent to Proofpoint in return for using the ET Pro Telemetry edition.
This paragraph describes the attributes from the eve.json log file that are collected to improve threat detection and the sensor health data to evaluate if the data is usable.
An example of an event is detailed below.
{
  "event_type": "alert",
  "proto": "IPV6-ICMP",
  "timestamp": "2018-04-17T18:38:04.498109+0200",
  "in_iface": "em1",
  "alert": {
    "category": "Generic Protocol Command Decode",
    "severity": 3,
    "rev": 2,
    "gid": 1,
    "signature": "SURICATA zero length padN option",
    "action": "allowed",
    "signature_id": 2200094
  },
  "src_ip": "xxxx:xxxx:fec0:d65f",
  "flow_id": 982154378249516,
  "dest_ip": "ff01:fe00:1200:8900:0000:f000:0000:0016"
}
Network addresses are needed to identify hosts which pose a higher risk to your and other peoples network, but your internal addresses are kept secret.
For this reason we mask the addresses found in the log file and only send the last number(s) to identify the host. In the example above the src_ip is an internal IPv6 address, for IPv4 we only collect the last number (e.g. 0-255).
Fields collected (unmodified):
timestamp |
Timestamp of the event |
flow_id |
Internal identifier for this communication flow |
in_iface |
Interface where the event was captured |
event_type |
Type of event |
vlan |
Vlan tag |
src_port |
Source port number |
dest_port |
Destination port number |
proto |
Protocol |
alert |
Alert details, such as the signature_id, action taken and associated message. |
tls |
TLS details, such as certificate subject and serial. |
http |
HTTP detail information such as the host, but omitting sensitive details such as path and user-agent. |
app_proto |
Application protocol (if known) |
Threats change often, to keep statistics valuable, the list of fields is subject to change
Note
The plugin comes with a small script to print eve output yourself, it’s called dump_data.py, when used with the -p parameter, it will output the data as it will be sent to Proofpoint. All script code can be found in the following directory /usr/local/opnsense/scripts/ids_telemetry/
Sensor health status collected and send as keep-alive:
Unique Sensor ID |
Unique sensor identification, helps identifying messages from the same system, without knowing who is the operator. |
OPNSense Version |
Current installed software version. This will help both for troubleshooting purposes (if a bad update is pushed and Proofpoint notices that deployments running version X have an issue) as well for planning, to understand how new features and functionality would be adopted. |
Suricata Version |
Suricata version installed. |
Suricata status |
Reports if the sensor is active, when not active, no detection/telemetry can be provided. |
System Time |
If the system time is not correct, it will impact the timestamps of messages, so knowing what time the system thinks it has will help reconcile the actual time. |
Active Ruleset Version |
The active ruleset version should match what is published. If sensors do not have the active version then they either haven’t configured scheduled updates or there is another issue. This will help Proofpoint to identify if there are widespread issues with updates. |
Number of rules enabled |
Helps to gain a better understanding about the number of rules people use on top of the ones provided by Proofpoint. |
Number of ETPro Telemetry Rules enabled |
Because users can control what rules they enable, they may not want to enable all ETPro Telemetry rules, if this is the case it would help Proofpoint understand how the rules are being leveraged so they can better write / tune rules |
Mode (IDS or IPS) |
This is helpful to understand how the system is deployed and is useful to development purposes to determine what rules we should be focusing on based on how our customers are using them. |
Suricata Log Stats |
For QA purposes, some fields with general stats are collected from /var/log/suricata/stats.log (capture.kernel_packets, decoder.pkts, decoder.bytes, decoder.ipv4, decoder.ipv6, flow.tcp, flow.udp, detect.alert) |